
Percepio
Continuous Observability for Embedded Software
Supercharge your embedded systems development with software observability throughout the product life cycle. Slash debugging time and expedite product delivery. Detect and debug issues in fielded devices remotely for swift solutions and dependable operation.
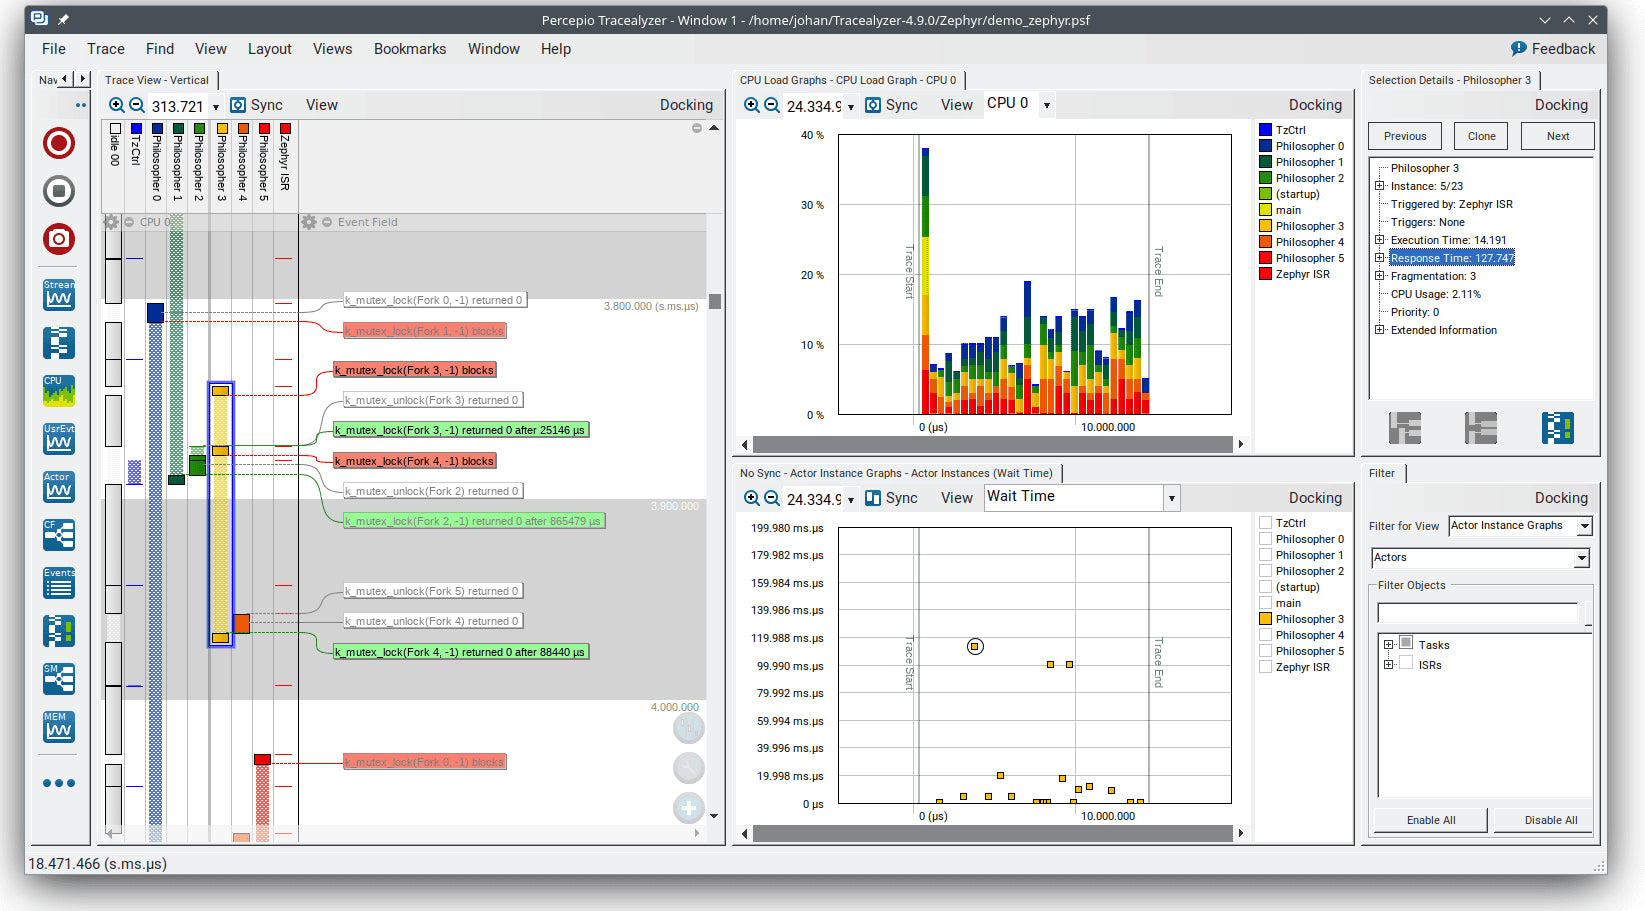
Percepio Tracealyzer
Percepio Tracealyzer revolutionizes embedded C/C++ debugging, eliminating tedious troubleshooting and accelerating development. Traditional debugging struggles with today’s complex RTOS and Linux systems, consuming 40-50% of development time.
Tracealyzer provides advanced profiling to reveal the events behind performance issues, helping you pinpoint bottlenecks and maximize hardware efficiency. Meet performance goals and deliver a responsive user experience with ease.
Optimizing multi-threaded RTOS/Linux systems is challenging, as slow threads often stem from hidden factors. Visual trace observability provides the full picture, simplifying optimization and debugging like never before.

Percepio DevAlert
Percepio DevAlert provides automatic alerts for detected errors, including core dumps and traces for quick issue diagnosis. Customize alerts with relevant device data like logs or sensor readings, all accessible via the DevAlert dashboard in your web browser.
With one-click remote debugging, inspect core dumps, call stacks, variables, and more—just like debugging a local device. Seamlessly integrate with Tracealyzer to analyze system traces and pinpoint issues before failures occur.
Lightweight alerts (kilobytes or less) ensure minimal impact, allowing devices to resume or restart without delay.
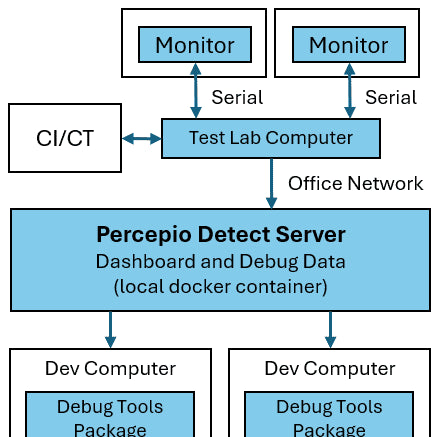
Percepio Detect
Percepio Detect expands Percepio’s observability tools, leveraging over a decade of expertise. It bridges development, testing, and maintenance gaps for RTOS-based embedded systems, offering deep observability for profiling, verification, and crash debugging.
Detect automatically captures debugging data on crashes, errors, and performance metrics, enabling instant issue resolution without reproduction. Monitor key parameters like timing, stack usage, and anomalies with minimal device impact.
Designed for standalone operation on production hardware, Detect requires only a basic connection (serial/Ethernet) and stores data in the Detect Server for seamless collaboration. View debugging insights instantly via an intuitive dashboard.
Webinar on Demand
Visualization of RTOS runtime behavior using Percepio Tracealyzer and Lauterbach uTrace
This webinar will give you insight into how Percepio Tracealyzer and Lauterbach uTrace unit can be integrated and give you runtime trace observability of your RTOS based application. We go through different use cases when Tracealyzer RTOS based trace is suitable and when you need the details of uTrace instruction trace.

Percepio Resources

Whitepaper - Improving the Reliability of the Internet of Things
DevAlert lets your devices provide automatic alerts on when errors are detected, including core dumps and traces that helps explain the problem. Define your own alerts and include any device data of relevance, for example logs or sensor readings.

Product sheet
Percepio Detect™ is a powerful observability tool designed to identify elusive stability risks in RTOS-based embedded software.