Debug & Trace Probes
– Market Leading Development Tools J-Link and J-Trace PRO
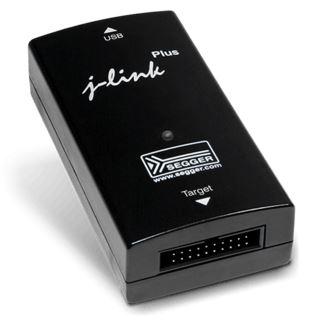
J-Link debug probes with outstanding performance, robustness, and ease of use.
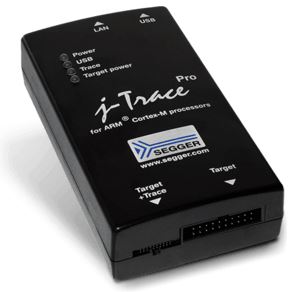
J-Trace PRO for instruction tracing with its streaming trace function that enables unlimited tracing at full clock speed.
 J-Trace for Cortex-M is a debug and trace probe designed for Cortex-M cores which includes trace (ETM) support.
Analyze, Verify, and Profile Your Code
- Real-time streaming trace at full System Clock
- Tune your application with live code profiling
- Satisfy regulatory requirements with instruction-level code coverage
- Isolate and identify hard-to-find code defects with unlimited trace
- Full J-Link debug functionality
 SEGGER J-Links are the most widely used line of debug probes available today. They´ve proven their value for more than 10 years.
- All popular debuggers and IDEs are supported
- Cross platform support (Windows, Linux, Mac)
- Ultrafast download speed into RAM and flash memory
- Unlimited breakpoints in flash memory
- Unique Real-Time Transfer technology (RTT)
- Multiple CPUs supported—8051, PIC32, RX, ARM7/9/11, Cortex-M/R/A, RISC-V
- Free software updates
- Built-in VCOM functionality
 J-Trace for Cortex-M is a debug and trace probe designed for Cortex-M cores which includes trace (ETM) support.
 SEGGER J-Links are the most widely used line of debug probes available today. They´ve proven their value for more than 10 years.